Sunday, October 29, 2006

A/D line follow thru

We got our divergence on the 10dma, and what do you know the very next day the biggest sell off since the beginning of Sept. We are now barely above the trend lines for both moving averages and so Monday will be a big day to see if the market movers will take it below. I personally hope it doesn't happen. I would like to see the market retain this level thru the elections. I would just feel alot more comfortable shorting this market after this event has taken place.


So the GDP numbers came in lower than expected, which naturally puts the already over talked about Housing bubble back in to play. Alot of Analysts have been calling for a bottom but the GDP data has shut those mouths for now. Inflation data came in lower at 2.3% but is still above the feds 2.0% desire. Bond markets have rallied hard in the last two days because of the GDP and inflation data, which puts the inverted yield curve at its highest level since its inversion began. This puts a growth scare still in play. Read John mauldin's recent report to get a more detail idea of all this data. http://frontlinethoughts.com/article.asp?id=mwo102706


The Smart Money is getting Bearish!!!!!


The dumb money is starting to, way off levels it was at in Jun, Jul & Aug


Thursday, October 19, 2006

A/D line Follow Up P/C ratio

We had our mild sell off if thats what it was, I personally think that they were distribution days where the big boys were locking in some profits. The volume was high and the indices finished in the red on one day and barely green the next. We have earnings coming out for the next two weeks, options exp tomorrow and goog blowing out numbers this evening. Inflation (core PPI and core CPI) came in above average but its difficult to tell if this is really a negative or not. Check out yesterdays (Wed Oct 18) blog from BigPicture.typepad.com There is a consenus from different bloggers about what this inflation theme means. For those who are wondering what core means it is the inflation data exluding food and energy (oil and gas). PPI= Producer ; CPI = Consumer

Also take notice on what was red today, $DJUSBK, $bkx (banks) and the $XBD (brokers). These were the two main sectors (financials) that lead this rally up.

We are devoloping a horizontal trend line on the 30dma (A/D line). It also tested the rising trend line and reversed.


The Smart money have rather quickly become bearish again, so a quick sell off could ensue soon. It would seem logical in my mind for the market to hold its course for another week or so that the dumb money can feel more optimistic and would join this rally. I read an article recently that talked about how the .78% fibbonaci retracement level for the S&P is around 1384 which would put the dow around 12100 to 12300. So we could see a move up to that area before a selloff happends. I am liking that scenario more and more especially with the dow closing above 12K.


Monday, October 16, 2006

A/D line (Internal Breadth) follow thru and other stuff

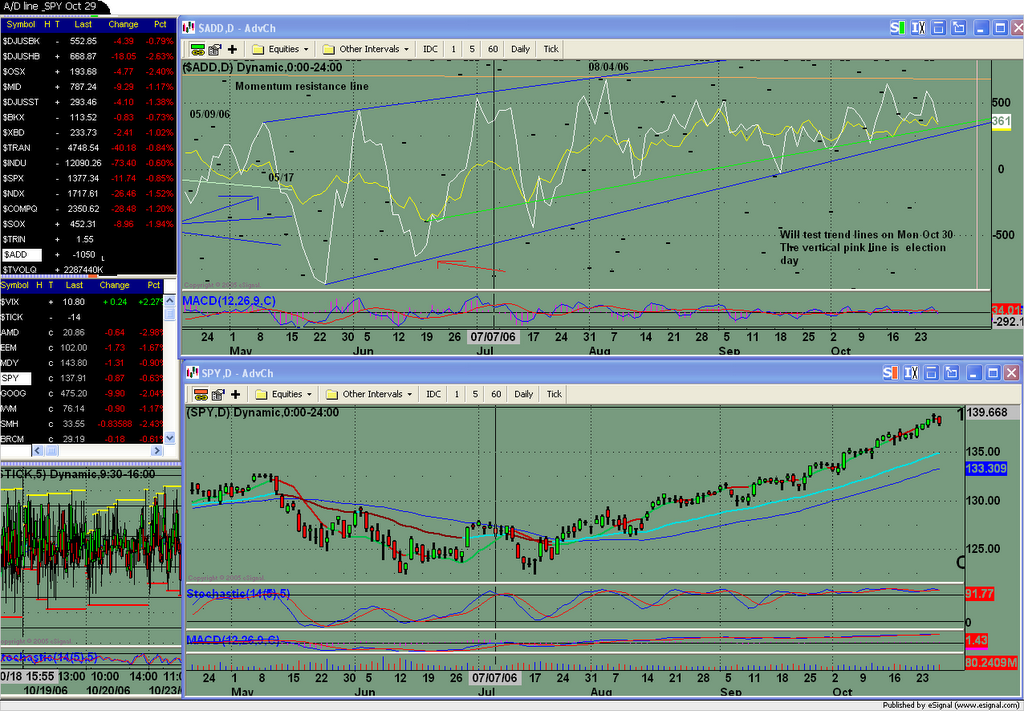
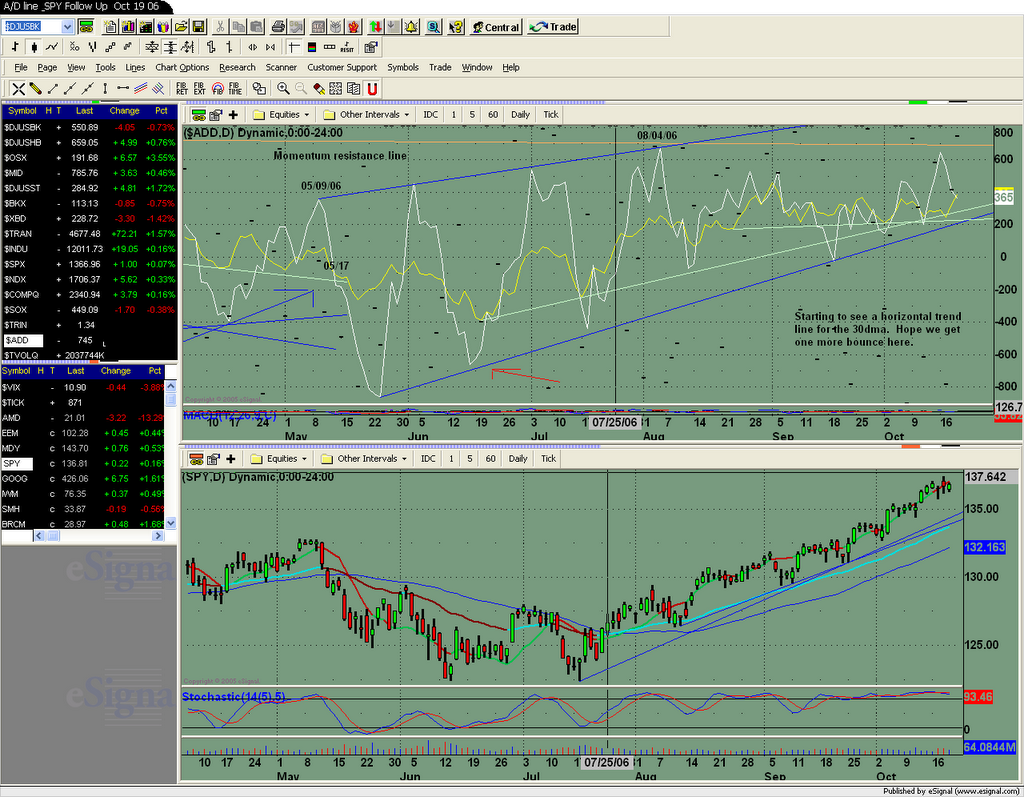
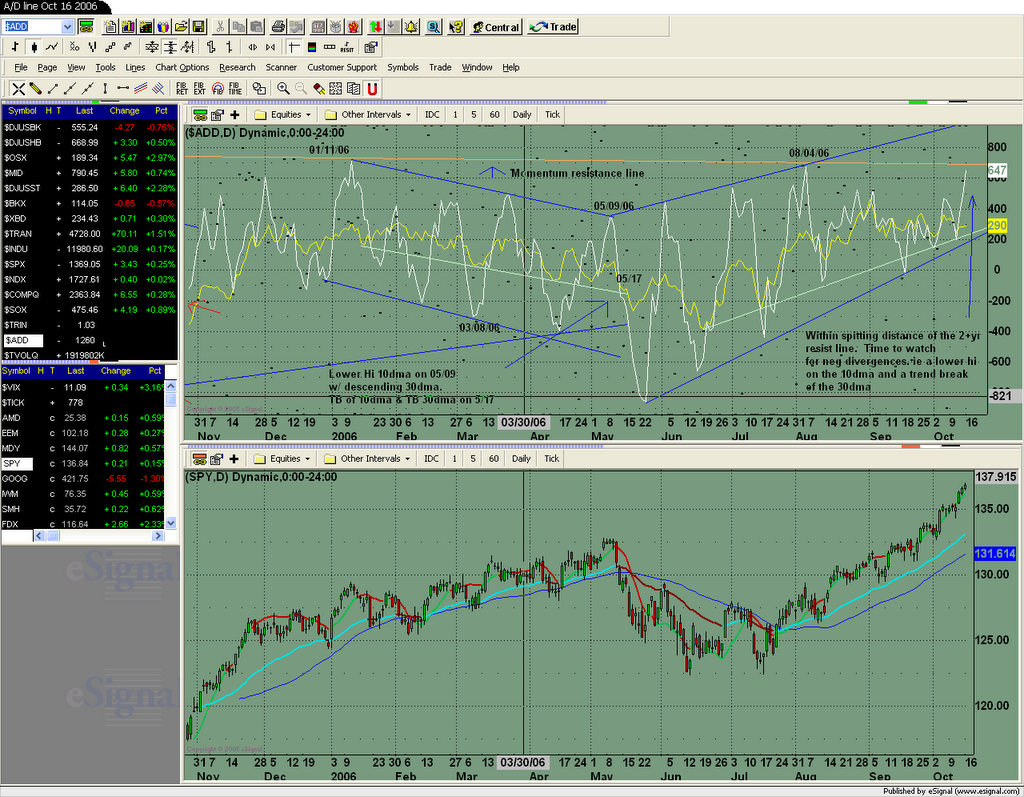
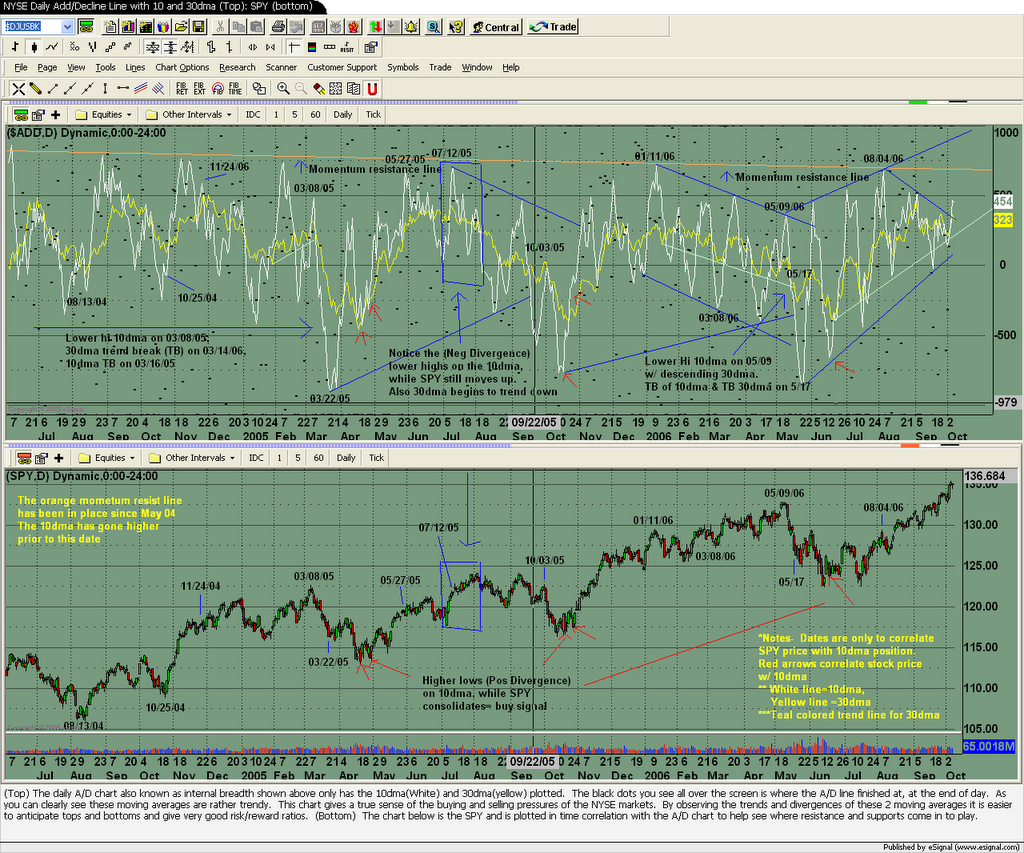
Ok, well we are now within spitting distance of the 2year momentum resistance line. It will be interesting to see if it can break thru it. Now is the time to look for neg divergences between the A/D line and the SPY, Another words, start looking for a stalling in the A/D line while the SPY continues higher. This doesnt mean that the SPY will not sell off mildly, it could but on the next up thrust of both the SPY and the A/D line start looking for a lower hi (compared to the hi that is happening right now) on the A/D line. If this occurs then we can anticipate a break of both the 10dma and 30dma trendlines sometime in the near future.

Another possibility is that this is the climax for this move and that the negative divergence lies between the high that is occuring right now and the high that happend on 08/04/06, but we wouldnt know this until the moving averages break their trend lines. I doubt that this is the case.
It is much more difficult to determine tops ( timing shorts using neg divergences) then to determine bottoms, (timing longs using positive divergences) this is just trading reality so beware of this before shorting heavily. Also remember that in strong bull markets it is possible that the sell off could be much milder than the sell offs that happen in milder bull markets. I would consider this a strong bull market.


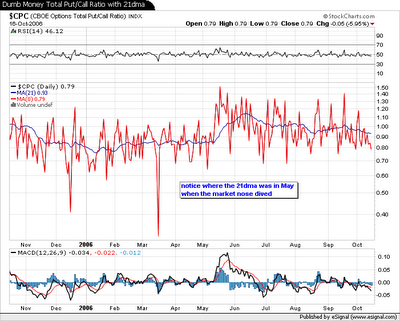
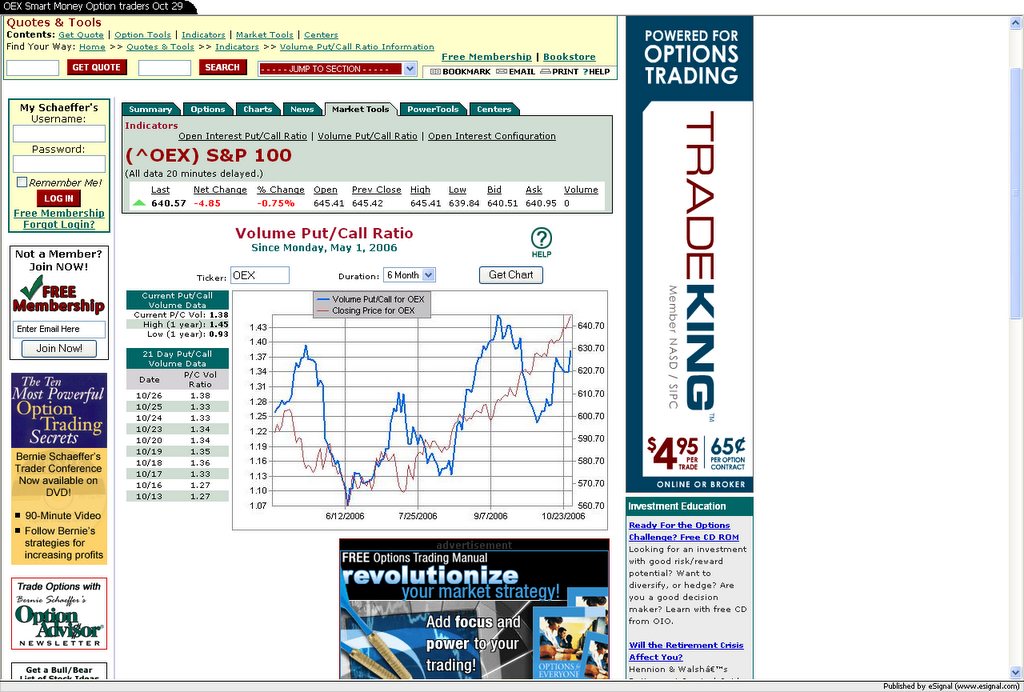
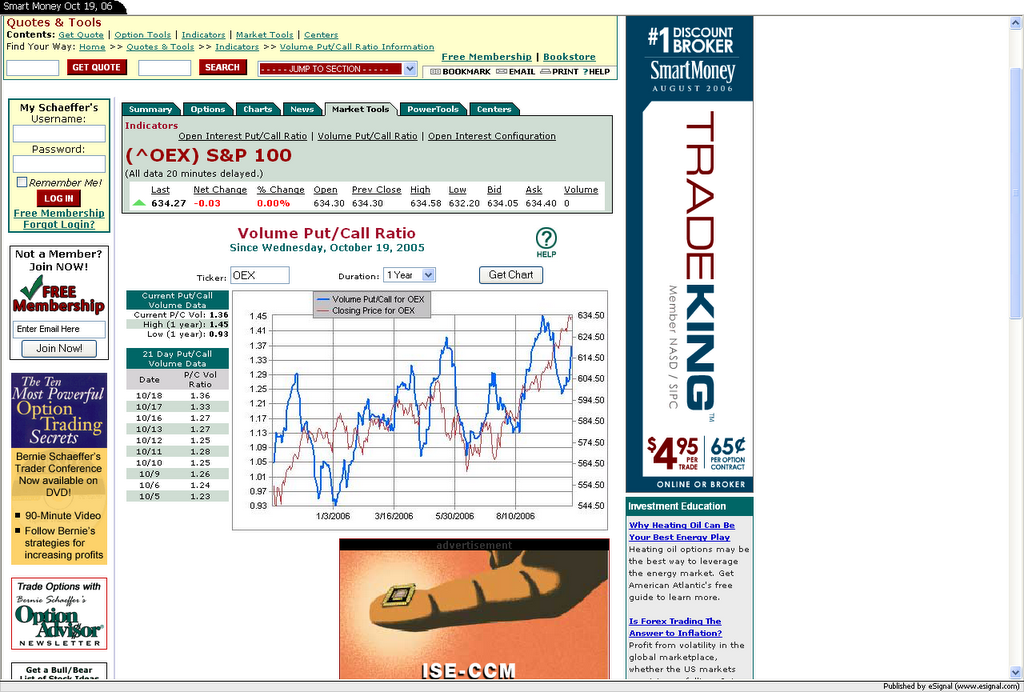
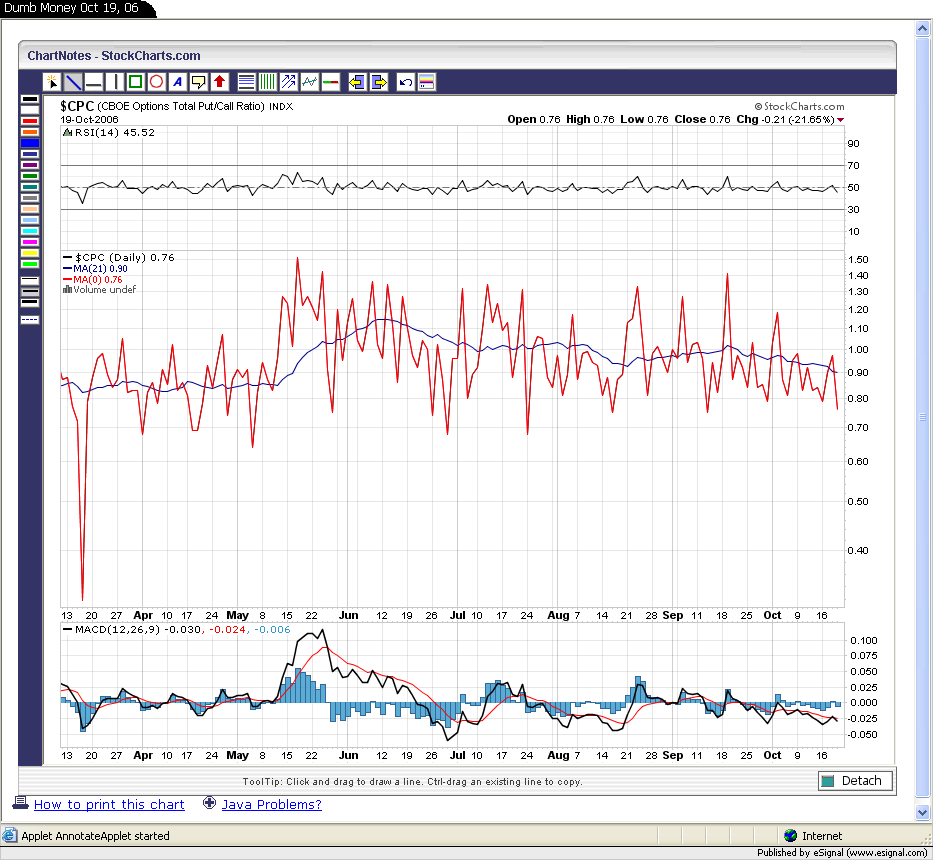
So to help us better time tops and bottoms we must also watch what the 'smart money' (OEX option traders) and the 'dumb money' (retail option traders-normal people like u and me) are doing. We do this by watching the 21dma put/call ratios of each. The smart money traders are called that because they short and go long at the right times and the dumb money short and go long at the wrong times. Just look at these charts to confirm this. The smart money did get it wrong back in Sept though, but this was the first time in a long time that they did get it wrong. Just goes to show that its never guaranteed. As you can see the Smart Money traders have become more bullish since the middle of Sept but recently the 21dma is starting to rise. If it continues to rise then it throws up a red flag.


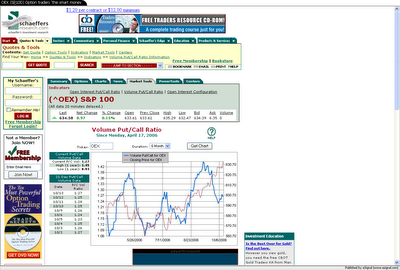
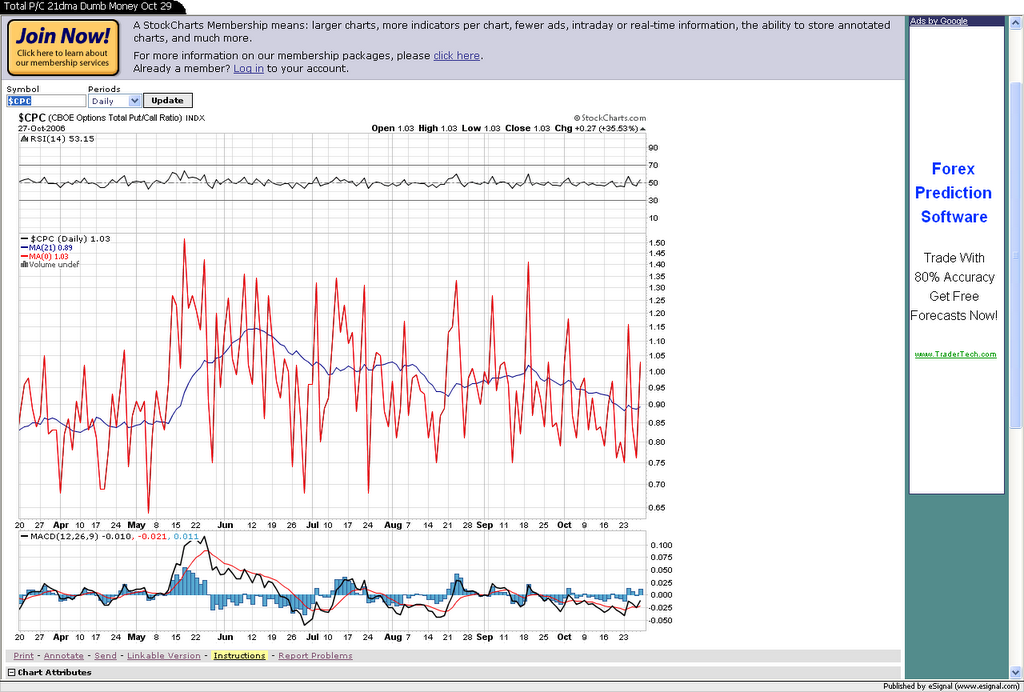
The dumb money traders are slowly becoming more bullish. I think we will see the 21dma dip dramtically here soon if the market can sustain its postering here until around elections but that is just my guess.

Sunday, October 08, 2006

Internal Breadth and Market Timing

Recently I have been on a quest to know when the market has hit bottoms or tops, and of course you'll never know for sure. I've tried MACD, RSI, Stochastics, CCI etc... Lately I have been studying the internal breadth, and honestly its just another indicator but atleast it gives dimension (shows strength, weakness) to the underlying trend and you can compare it to past market movements. Of course other indicators do the same thing but I think they lack a quantitative sense (to take a science term). You be the judge. If you donot watch the Add/Decline (A/D line) line it simply is a measure of the number of stocks advancing to the # declining. So if u see a number +600 than there are 600 more stocks advancing than Declining. I have only focused on the NYSE so this chart does not correlate to the overall NASDQ market.

This chart has alot on it and its gonna take a few to understand it, but it is just 2 plotted moving averages and there trends and another chart, SPY to compare stock price to internal Breadth. Dont forget to read the note below these charts.

Wednesday, October 04, 2006

Breaking my Blogging Cherry

Well there has to be a first to everything and this is it, atleast in the scope of my bloggingness. Gonna keep it short cause i wanna see my precious creation, plus the fact that I am more impatient then the perverbial one pump chump. Yeoooo!