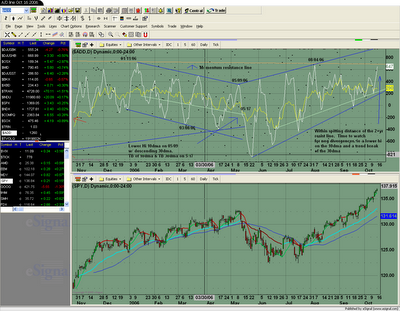
Another possibility is that this is the climax for this move and that the negative divergence lies between the high that is occuring right now and the high that happend on 08/04/06, but we wouldnt know this until the moving averages break their trend lines. I doubt that this is the case.
It is much more difficult to determine tops ( timing shorts using neg divergences) then to determine bottoms, (timing longs using positive divergences) this is just trading reality so beware of this before shorting heavily. Also remember that in strong bull markets it is possible that the sell off could be much milder than the sell offs that happen in milder bull markets. I would consider this a strong bull market.

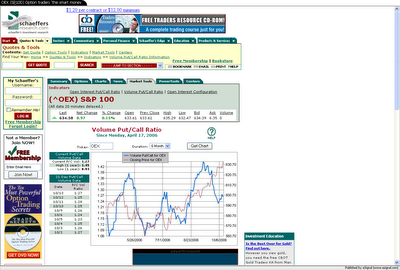
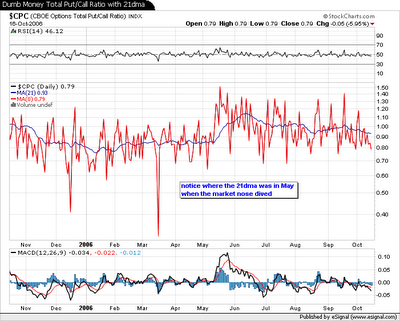
So to help us better time tops and bottoms we must also watch what the 'smart money' (OEX option traders) and the 'dumb money' (retail option traders-normal people like u and me) are doing. We do this by watching the 21dma put/call ratios of each. The smart money traders are called that because they short and go long at the right times and the dumb money short and go long at the wrong times. Just look at these charts to confirm this. The smart money did get it wrong back in Sept though, but this was the first time in a long time that they did get it wrong. Just goes to show that its never guaranteed. As you can see the Smart Money traders have become more bullish since the middle of Sept but recently the 21dma is starting to rise. If it continues to rise then it throws up a red flag.

The dumb money traders are slowly becoming more bullish. I think we will see the 21dma dip dramtically here soon if the market can sustain its postering here until around elections but that is just my guess.

No comments:
Post a Comment