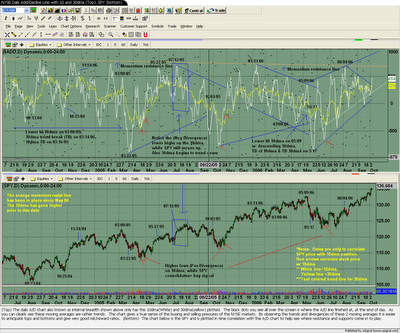
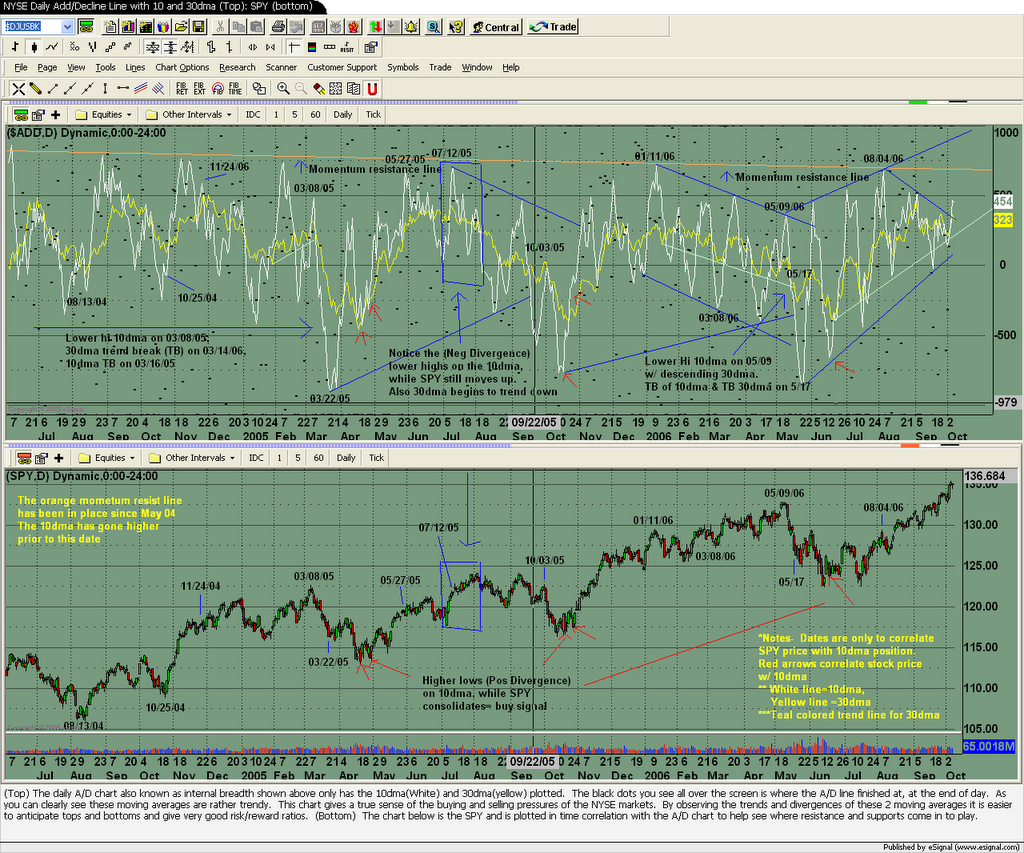
Recently I have been on a quest to know when the market has hit bottoms or tops, and of course you'll never know for sure. I've tried MACD, RSI, Stochastics, CCI etc... Lately I have been studying the internal breadth, and honestly its just another indicator but atleast it gives dimension (shows strength, weakness) to the underlying trend and you can compare it to past market movements. Of course other indicators do the same thing but I think they lack a quantitative sense (to take a science term). You be the judge. If you donot watch the Add/Decline (A/D line) line it simply is a measure of the number of stocks advancing to the # declining. So if u see a number +600 than there are 600 more stocks advancing than Declining. I have only focused on the NYSE so this chart does not correlate to the overall NASDQ market.
This chart has alot on it and its gonna take a few to understand it, but it is just 2 plotted moving averages and there trends and another chart, SPY to compare stock price to internal Breadth. Dont forget to read the note below these charts.
No comments:
Post a Comment